ADVERTISEMENTS:
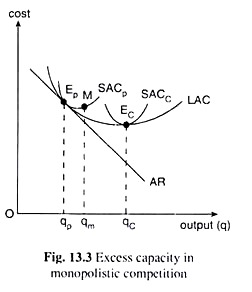
In Fig. 13.3, the long-run equilibrium point of the firm is the point Ep, and the output at this point is qp which is smaller than the ideal output qc. Hence, it is said that there is excess capacity in monopolistic competition, the amount of excess capacity here is qc – qp.
Now, at the long-run equilibrium point of the firm, Ep, at q = qp, the plant size is represented by the curve SACp. This is considered to be the long-run optimal plant size. It is seen in Fig. 13.3 that the firm is not operating at the minimum point, M, of the long-run optimal plant curve SACp; i.e., it is not operating at the minimum cost of this plant producing the output q = qm.
From a social point of view, the resources used by the firm would have been more efficiently utilised if q = qm, rather than q = qp (qp < qm), were produced. Thus, qm – qp is a portion of the total excess capacity qc– qp, which is applicable to socially inefficient utilisation of the resources actually used (in the plant represented by SACp).
The remaining portion of excess capacity, viz., qc – qm, arises because the optimal plant size from the point of view of society differs from that from the point of view of the individual firm. The firm under monopolistic competition does not employ enough of society’s resources to attain the minimum unit cost.
ADVERTISEMENTS:
Therefore, that excess capacity is composed of two parts as illustrated in Fig. 13.3. These two parts are qm – qp and qc – qm and the total excess capacity is the sum total of these two parts which is equal to qc – qp.
Let us now see how Chamberlin differs from the concepts of ideal output and excess capacity that we have expounded above. According to Chamberlin, our view of ideal output so far emerges from the horizontal demand curve of a perfectly competitive firm. It is possible for a firm to attain the ideal output at the minimum point of the LAC only when its demand curve is a horizontal straight line.
Chamberlin argues that if the demand curves of individual firms are negatively sloped and if there is active price competition under free entry to the product-group as under monopolistic competition, then the output at the minimum point of LAC (i.e., q = qc in Fig. 13.3) can no longer be considered to be the ideal output. Chamberlin argues that product heterogeneity under monopolistic competition does not lack ideality.
 It is a real world and ideal situation in so far as variety is desired per se, by the people. The horizontal demand curve of a firm arises from product homogeneity and the negatively sloped demand curve arises from product heterogeneity.
ADVERTISEMENTS:
Therefore, if the product heterogeneity is an ‘ideal’ situation, then the negatively sloped demand curve is nothing un-ideal and the long-run equilibrium at a point on the LAC curve to the left of its minimum point should not be considered as lacking in ideality.
According to Chamberlin, “differentness” or heterogeneity may be considered a quality of the product and, just like any other quality, it involves a cost. The cost of ‘differentness’ is represented by production to left of the minimum average cost.
The difference between the output at minimum cost, the so-called ideal output, and the actual long-run equilibrium output, is then a measure of the ‘cost’ of producing differentness (or variety) rather than a measure of ‘excess capacity’.
But this is true, it may be noted, only so long as the market is characterised by an effective price competition. In the case of price competition, Chamberlin regards production at the point Ep, or the output q = qp, as a sort of ideal for which there is product differentiation.
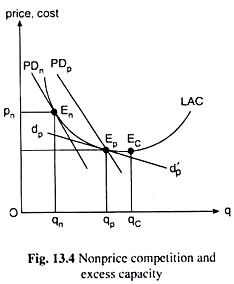
Chamberlin argues that monopolistic competition in the long run, does not give rise to excess capacity so long as there is active price competition in the market, However, if there is free entry along with the absence of price competition, there would be excess capacity. This type of excess capacity is explained with the help of Fig. 13.4.
 In Fig. 13.4, LAC is the long-run average cost curve of the firm. If there is free entry and price competition, long-run equilibrium is attained at Ep, i.e., at q = qp, where the perceived demand (AR) curve dpd’p has been a tangent to the LAC curve.
As we know that, Ep would lie to the left of the competitive equilibrium Ec, but with free entry and active price competition, the AR curve would tend to become more elastic and its tangency point with LAC, viz., Ep, will tend to lie rather close to Ec, i.e., Chamberlin’s ideal output would tend to become close to the conceptual ideal outlook at the minimum point of the LAC curve.
ADVERTISEMENTS:
However, for many reasons, active price competition may not exist in some markets. A “live and let live” outlook on the part of the sellers, tacit agreements, open price associations, price maintenance, customary prices, and professional ethics are a few causes of nonaggressive price policies. But if price competition is lacking, individual entrepreneur would not tend to perceive an AR curve like dpd’p.
Rather, they will be concerned with the effects of a general price rise or fall in the market for the product- group upon their share of the demand, i.e., they will be concerned only with the proportional demand (PD) curve.
Under such circumstances, long-run equilibrium of the firm and the group under monopolistic competition will occur only when the number of firms has become so large as to push the PD curve, PDp, leftward to a position, PDn, of tangency with the LAC curve at the point En. Equilibrium is attained at the point En with output, qn, and price, pn.
Since q = qn, is less than what might have been obtained, viz., q = qp, under active price competition, here the firm would have an excess capacity. Chamberlin argues that the measure of excess capacity here would be qp – qn. Therefore, according to Chamberlin, there may be excess capacity in monopolistic competition only in the absence of an active price competition.