The attachment is the data set on the project data sales tab. Then, each title is broken down to show the mean, standard deviation, etc. Instructions below. Complete the following four hypotheses, using α = 0.05 for each. The week 5 spreadsheet can be used in these analyses. 1. Mean sales per week exceed 42.5 per salesperson 2. The proportion receiving online training is less than 55% 3 Mean calls made among those with no training is at least 145 4. Mean time per call is 14.7 minutes Using the same data set from part A, perform the hypothesis test for each speculation in order to see if there is evidence to support the manager’s belief. Use the Eight Steps of a Test of Hypothesis from Section 9.1 of your textbook as a guide. You can use either the p-value or the critical values to draw conclusions. Be sure to explain your conclusion and interpret the claim in simple terms. Compute 99% confidence intervals for the variables used in each hypothesis test and interpret these intervals. Wr
Hypothesis Testing and Confidence Intervals
Mean Sales Per Week
Hypothesis
We test the hypotheses;
H0: µ ≤ 42.5
Ha: µ > 42.5
The level of significance is alpha = 0.05
Table 1: One-Sample t-test for mean sales per week
| t-Test: one-Sample | |
| Sales (Y) | |
| Mean | 41.89 |
| Variance | 70.32111111 |
| Observations | 100 |
| Hypothesized Mean | 42.5 |
| df | 99 |
| t Stat | -0.727422907 |
| P(T<=t) one-tail | 0.234341858 |
| t Critical one-tail | 1.660391156 |
| P(T<=t) two-tail | 0.468683716 |
| t Critical two-tail | 1.984216952 |
The hypothesis test is one-tailed, more specifically, right-tailed. Therefore, we reject the null hypothesis if the test statistic value is greater than the critical value. The table indicates that the resulting p-value is 0.2343, which is greater than the level of significance, 0.05. Thus, we fail to reject the null hypothesis and conclude that mean sales per week per person does not exceed 42.5 at a 5% level of significance.
Confidence Intervals
The 99% confidence interval for the mean sales per week is given by:
Where:
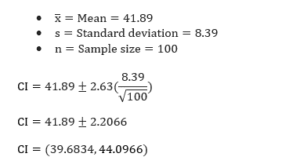
Therefore, we are 99% confident that the true mean lies between 39.6834 and 44.0966.
Proportion Receiving Online Training
Hypothesis Test
We test the hypotheses;
H0: p ≥ 0.55
Ha: p < 0.55
Alpha = 0.05
Standard Error =
Z =
Table 2: Proportion break-down
| Observed Proportion | 0.53 |
| Hypothesized Value | 0.55 |
| Standard error | 0.049749372 |
| Z statistic | -0.402015126 |
| Z critical value (one-tailed) | -1.645 |
| P-value | 0.34458 |
| Alpha | 0.05 |
| Decision | Fail to reject the null hypothesis |
The test is left-tailed, and thus, we reject the null hypothesis when the test statistic is less than the critical value. Since the resulting Z statistic value of -0.40 is greater than the critical value, we fail to reject the null hypothesis. The implication is that the proportion of people receiving online training is not less than 55%, at a 95% confidence level.
Confidence Level
The 99% confidence level for the proportion of individuals receiving online training is given by;
=
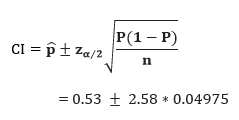
= [0.40, 0.66]
We are 99% confident that the proportion of people receiving online training lies between 40% and 66%.
Mean Calls Made Among Those with No Training
Hypothesis Test
We test the hypotheses;
H0: µ ≤ 145
Ha: µ > 145
Alpha = 0.05
Table two: One-Sample t-test for
| t-Test: One-Sample | |
| Calls (X1) | |
| Mean | 140.8888889 |
| Variance | 94.33986928 |
| O
Order a similar paper
| |