ADVERTISEMENTS:
Monopolistic competition is more apt to be found in distributing and retailing, where the market can be divided into many small segments without suffering diseconomies of scale. In contrast, oligopoly is found when economies of scale require that the market be supplied by a few large firms. This condition is normally found in manufacturing, insurance and international banking.
In both monopolistic competition and oligopoly markets have groups of products that are close substitutes yet differentiated in some respect in the eyes of the buyer. It is not necessary that the product be physically or chemically different. Manufacturers and sometimes distributors or retailers spend a substantial amount of money to persuade consumers that one brand is somehow different from essentially the same product under a different label. Each firm, of course, has a legal monopoly on its registered trademarks and brand names.
Firms may also compete while dealing in the same product by differentiating on some other basis, such as service facilities, credit arrangements and location. For example, two service stations may offer the same brand of petroleum products and essentially the same services, but their different locations make them different and each has a monopoly in its location.
In both monopolistic competition and oligopoly competition is perfect rather than impersonal. Each seller is acutely aware of competitors and is constantly striving to out-manoeuvre them in order to gain an advantage. Each seller is also aware that there are two demand curves in the market. One is for the whole market, that is, for the aggregate demand for all products that are close substitutes of each other. The other demand curve represents the firm’s share of the market.
ADVERTISEMENTS:
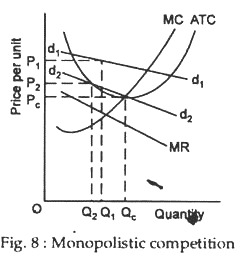
In Fig. 8 d1d1 = original short-run demand curve
d2d2 = demand curve after long-run adjustment
MR = original marginal revenue curve.
Figure 8 sets forth the theoretical picture of a monopolistically competitive industry. Because a monopolistic competitor is only one of numerous firms selling a product which has many close substitutes, the firm’s demand curve (dd) in Fig. 8 is almost horizontal.
 As shown in the figure, the firm can earn excess profits in the short run with a price of P1 and an output of Q1. In the long run, however, the existence of this high profit level is a signal for more firms to enter, for the original firm’s demand curve to fall to d2d2, for the price to fall to P2 and for output to settle at Q2.
While the seller of egg roll may be able to marginally differentiate his rolls from that of the competitors, the absence of barriers to entry means that other potential competitors will constantly be trying to emulate his success and reduce his pricing power.
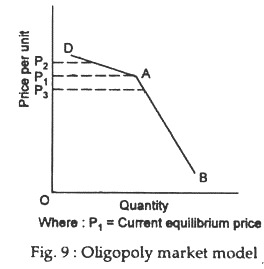
The analysis set forth in Fig. 9 is that of an oligopolist. It describes a situation of interdependence in which the individual oligopolist faces the kinked demand curve DAB and is unwilling to depart from the current price to P3. If an oligopolist raises his price to P2, he fears that no one will follow and his sales will fall sharply.
 On the other hand, if he lowers his price unilaterally to P3, he fears that everyone else will match his price and he will be worse off. The novelty of the kinked demand curve is that it describes a static equilibrium situation in which no price change will take place.